- Archive Intune logs to an Azure storage account to keep the data, or archive for a set time.
- Stream Intune logs to an Azure event hub for analytics using popular Security Information and Event Management (SIEM) tools, such as Alien Vault, Splunk and QRadar.
- Integrate Intune logs with your own custom log solutions by streaming them to an event hub.
- Send Intune logs to Log Analytics to enable rich visualizations, monitoring, and alerting on the connected data.
In this example I'll archive the data to a storage account for analysis later.
What do we need?
- Azure subscription
- Intune
- Global Admin or Intune Service Administrator account
- Azure storage account with ListKeys permission (you'd need a different Azure service depending on where you want to route the logs)
So let's configure this logging.
In the Azure portal navigate to Intune

Select Diagnostics Settings and turn it on.

We can see three options:
- Archive to a storage account: Saves the log data to an Azure storage account. Use this option if you want to save or archive the data. (this is the one we will use)
- Stream to an event hub: Streams the logs to an Azure event hub. If you want analytics on your log data using SIEM tools, such as Splunk and QRadar, choose this option.
- Send to Log Analytics: Sends the data to Azure log analytics. If you want to use visualizations, monitoring and alerting for your logs, choose this option

See the event hub configuration (if this was our preferred option).......

....or the log analytics (if this was our preferred option).

We'll just choose an Azure storage account (our option).

Enter a descriptive name for the diagnostic setting and configure the retention period in days. Save the setting.

The diagnostic setting has been created. You can edit this afterwards.
Cost
Remember that there will be a cost associated with this logging. See the Microsoft docs for more details.
Reviewing the logs
After an action the corresponding log will show up in the storage account between 5 and 15 minutes later and it's very easy to review the logs.
Navigate to Azure Storage accounts

and select the storage account you configured earlier.
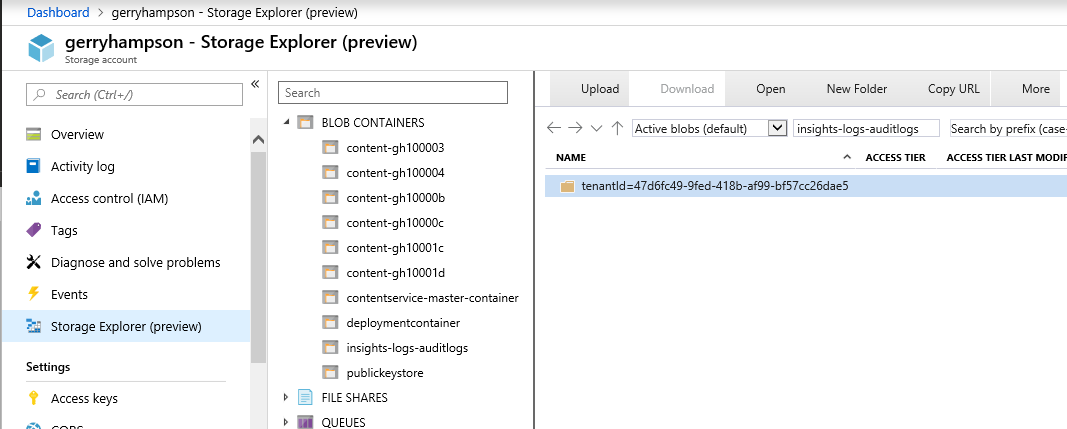
Select Storage Explorer (also in Preview). You'll see a new Blob container - "Insights-log-auditlogs"
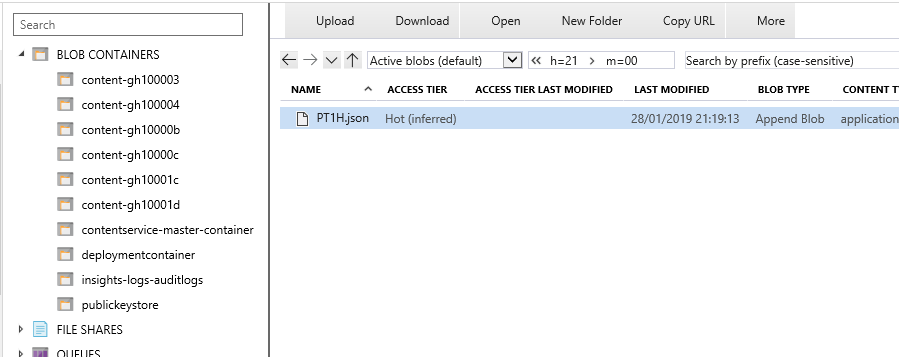
Drill down into the container and you'll find a .json file.
You can open the file in a browser to see the logs. See that some managed devices were deleted. I wonder who did that.

The Azure Storage Explorer tool is another option and is also handy for browsing this content. Download it from here

Install the tool and sign in to Azure.

Choose your subscription and select Apply.

How you can browse and open the logs.

Look who deleted the managed devices. I'll have to talk to him.
This is a brilliant new feature. I hope this blog post helps. Until next time.....